Tuesday, June 24, 2014

clj-relative-time 0.1.1

Running automated reports and queries often involves date ranges. Clj-relative-time library translates a human readable relative date period string into absolute begin and end dates. This library is based on clj-time.

Supported vocabulary

["this" "last" "prev"] ; minor term
[1 2 3 4 ...]  ; middle term, an integer
["day" "week" "4week" "month" "calmonth" "quarter" "half" "year"] ; major term

Usage

git clone https://github.com/loganis/clj-relative-time.git
cd clj-relative-time
lein test
(:use clj-relative-time.core)
(period2begend "last_2_weeks") ; {:beg "2014-06-16", :end "2014-06-23"}

;;Example definitions

;;Last week:
    {:beg (-> now (dminus (-> 7 (* middle) (ddays))) (dformat))
     :end (-> now (dminus (-> 1 (ddays))) (dformat))}
;;Last calendar month
    {:beg (-> now (dminus (-> middle (dmonths)))
                  (dminus (-> (- dom 1) (ddays))) (dformat))
     :end (-> now (dminus (-> dom (ddays))) (dformat))}

Sample test output

...
{:last_1_day {:beg "2014-06-23", :end "2014-06-23"}}
{:last_1_week {:beg "2014-06-17", :end "2014-06-23"}}
{:last_1_4week {:beg "2014-05-27", :end "2014-06-23"}}
{:last_1_month {:beg "2014-05-27", :end "2014-06-23"}}
{:last_1_calmonth {:beg "2014-05-01", :end "2014-05-31"}}
{:last_1_quarter {:beg "2014-01-01", :end "2014-03-31"}}
{:last_1_half {:beg "2013-07-01", :end "2013-12-31"}}
{:last_1_year {:beg "2013-01-01", :end "2013-12-31"}}
{:last_2_day {:beg "2014-06-22", :end "2014-06-23"}}
{:last_2_week {:beg "2014-06-10", :end "2014-06-23"}}
{:last_2_4week {:beg "2014-04-29", :end "2014-06-23"}}
{:last_2_month {:beg "2014-04-29", :end "2014-06-23"}}
{:last_2_calmonth {:beg "2014-04-01", :end "2014-05-31"}}
{:last_2_quarter {:beg "2013-10-01", :end "2014-03-31"}}
{:last_2_half {:beg "2013-01-01", :end "2013-12-31"}}
{:last_2_year {:beg "2012-01-01", :end "2013-12-31"}}
{:last_3_day {:beg "2014-06-21", :end "2014-06-23"}}
{:last_3_week {:beg "2014-06-03", :end "2014-06-23"}}
{:last_3_4week {:beg "2014-04-01", :end "2014-06-23"}}
{:last_3_month {:beg "2014-04-01", :end "2014-06-23"}}
{:last_3_calmonth {:beg "2014-03-01", :end "2014-05-31"}}
{:last_3_quarter {:beg "2013-07-01", :end "2014-03-31"}}
{:last_3_half {:beg "2012-07-01", :end "2013-12-31"}}
{:last_3_year {:beg "2011-01-01", :end "2013-12-31"}}
...

Features

  • Letter case and plural insensitive ("This_2_Week" and "this_2_weeks" are the same)
  • Space also can be used ("This 2 Weeks" and "this_2_week" are the same)
  • Source code is hosted on Github.com
  • Distributed under the Eclipse Public License, the same as Clojure.

Your feedback is welcome.

Monday, March 4, 2013

Scatter Plot Matrix for Incanter

A Scatter Plot Matrix chart can be useful when exploring relationship between metrical variables of a data-set. Today we share a working implementation of a scatter plot matrix function written in Clojure using Incanter, an R-like statistical computing and graphics environment.

Scatter plot matrix of iris experiment data-set using Clojure, Incanter and JFreeChart

What features are implemented?

  • Histogram in the diagonal for each metrics
  • Variance calculated for each metrics
  • Spline chart added to each histogram
  • Scatter Plot for each metric pairs
  • Correlation calculated for each metric pairs
  • Grouping option for a categorical dimension
  • Metrics are sorted according to the correlation with other metrics
  • Show only the n most correlating metrics
  • Show only the upper triangle of the plot matrix
Scatter plot matrix of chick-weight experiment data-set using Clojure, Incanter and JFreeChart

Usage of Scatter Plot Matix

If you do not have Leiningen install it.

cd ~/bin
wget https://raw.github.com/technomancy/leiningen/stable/bin/lein
chmod a+x lein

To see the Iris demo, do the following:

cd ${YOURWORKINGDIRECTORY}
git clone git://github.com/loganisarn/scatter-plot-matrix.git
cd scatter-plot-matrix
lein run

To generate and run a jar file:

lein uberjar
java -jar target/spm-0.1.0-standalone.jar

Those who use Emacs:

emacs src/spm/core.clj
M-x clojure-jack-in or 
M-x nrepl-jack-in

More details can be read in the project's github repository.

scatter-plot-matrix function options

(scatter-plot-matrix data & options)

   Options:
   :data data (default $data) the data set for the plot.
   :title s (default "Scatter Plot Matrix").
   :bins n (default 10) number of bins (ie. bars) in histogram.
   :group-by grp (default nil) name of the column for grouping data.
   :only-first n (default 6) show only the first n most correlating columns of the data set.
   :only-triangle b (default false) shows only the upper triangle of the plot matrix.

   Examples:

   (view (scatter-plot-matrix (get-dataset :iris) :bins 20 :group-by :Species ))
   (with-data (get-dataset :iris) (view (scatter-plot-matrix :bins 20 :group-by :Species )))
   (view (scatter-plot-matrix (get-dataset :chick-weight) :group-by :Diet :bins 20))

Detailed usage examples

Defining data source.
;;;Input examples for iris
  ;; Input dataset examples: Incanter data repo, local file, remote file (url)
  (def iris (get-dataset :iris))
  (def iris (read-dataset "data/iris.dat" :delim \space :header true)) ; relative to project home
  (def iris (read-dataset "https://raw.github.com/liebke/incanter/master/data/iris.dat" :delim \space :header true))
Filtering for specific columns.
;; Filter dataset to specific columns only
  (def iris ($ [:Sepal.Length :Sepal.Width :Petal.Length :Petal.Width :Species] (get-dataset :iris)))
  (def iris (sel (get-dataset :iris) :cols [:Sepal.Length :Sepal.Width :Petal.Length :Petal.Width :Species] ))
Defining a chart object with default options.
;;; Scatter plot matrix examples
  ;; Using default options
  (def iris-spm (scatter-plot-matrix iris :group-by :Species))
  ;; filter to metrics only, no categorical dimension for grouping
  (def iris-spm (scatter-plot-matrix :data ($ [:Sepal.Length :Sepal.Width :Petal.Length :Petal.Width] iris)))
Defining a chart object using more options.
(def iris-spm (scatter-plot-matrix iris
                                     :title "Iris Scatter Plot Matrix"
                                     :bins 20 ; number of histogram bars
                                     :group-by :Species
                                     :only-first 4 ; most correlating columns
                                     :only-triangle false))

Viewing and saving scatter plot matrix chart

View on Display. Set chart width and height according to your needs.
(view iris-spm :width 1280 :height 800)
Save as PDF document using save-pdf Incanter function. (Click to see an example PDF output)
(save-pdf  iris-spm "out/iris-spm.pdf" :width 2560 :height 1600)
Save as PNG image using save Incanter function. (Click to see an example PNG output)
 (save iris-spm "out/iris-spm.png" :width 2560 :height 1600)

We get some suggestions that a browser-client output would be a nice alternative to JFreeChart. D3 and C2 were suggested.

Scatter plot matrix of airline data-set using Clojure, Incanter and JFreeChart

As you can see above, the airline shows that a scatter plot matrix function is useful for one metric pair and one categorical dimension.

Feedback is Welcome

Thank you for your comments and feedback. We hope you find our scatter plot matrix function implementation useful. Have a nice day using Clojure.

Sunday, February 24, 2013

Scatter Plot Matrix in Incanter and Clojure Screenshot Preview

Scatter Plot Matrix is useful in getting a quick insight of a data-set with correlating features. In this post I share some early screenshots of a working implementation of a scatter plot matrix function in Clojure and Incanter using two data-sets: iris and chick-weight.

Scatter plot matrix of iris experiment data-set using Clojure, Incanter and JFreeChart

As you can see on the iris chart above, axis is not yet correctly adjusted to the min and max values of the metrics. Yeah. There are many details of a simple scatter-plot-matrix function. It is a Clojure-Incanter-Java learning-by-doing-mini-project with a fellow Loganis researcher, exploring details of Incanter and JFreeChart usage in Clojure.

Our Scatter Plot Matrix function implementation has histogram charts of metrics in the diagonal of the matrix chart, and scatter plots of combinations of metric pairs. You can group values by a categorical dimension, in the footer you can see the value names of colors used.

Scatter plot matrix of chick-weight experiment data-set using Clojure, Incanter and JFreeChart

Chick-Weight experiment is another built in data-set in Incanter. In my next post I am going to provide more details of our scatter plot matrix implementation for Incanter with source code using the same EPL 1.0 license as Clojure.

If you have any idea how to make an Incanter Scatter Plot Matrix function more useful, please share your thoughts with us.

Tuesday, January 15, 2013

Part 5 of Exploring Google Analytics data using Clojure, Incanter and MongoDB

Early Explorers used tools like the quadrant or a compass in their navigation. We use Clojure, Incanter and MongoDB to Explore Google Analytics Traffic Sources data. Today we build a simple interactive GUI application that works similar to the autofilter feature of any popular spreadsheet application.

Util.clj

We introduce a new function that requires a weight column produced by weighted-sort-row, and 2 metrics produced by classify-row. As described in Part 2 we use a simple classification method: below average:0, average:1, above average:2.
(defn view-traffic-sortable-sliders
  "View weighted-sorted table from col2 using SourceMedium names from col1 weighted-sort by wsortby, Categories for X, Categories for Y"
  [col1 col2 wsortby xcat ycat]
  (let [dat1 (fdb col2)
        ;; Human readable SourceMedium values                                                                                                                                    
        soum (fdr col1 :SourceMedium)
        ;; Merge Human readable col1 :SourceMedium column to col2 and sort by wsortby                                                                                            
        data ($order wsortby :asc (conj-cols dat1 (map (fn [y] (nth soum y)) ($ :SourceMedium dat1))))
        table (data-table data)]
    (view table)
    (sliders [slider_x (range 3)
              slider_y (range 3)]
             (set-data table ($where {xcat slider_x ycat slider_y} data)))))

Desktop.clj

We use :BounceRateW weights and 2 sliders :BounceRateC and :PagesVisitC. By changing the slider values from 0 to 2 the table shows only those traffic sources that have the same value as sliders show.
(view-traffic-sortable-sliders :m1 :m2 :BounceRateW :BounceRateC :PagesVisitC)
The screenshot above shows traffic sources that have below average Bounce Rate and above average Pages per Visit values weighted-sorted by ascending Bounce Rate. You may use view-traffic-sortable-sliders function for other metrics or using other weight.
(view-traffic-sortable-sliders :m1 :m2 :PagesVisitW :AvgVisitDurationC :NewVisitsC)
This example filters traffic sources table according to :AvgVisitDurationC and :NewVisitsC weighted-sorted by :PagesVisitW.

Distribution of clusters

A matrix view of the distribution of 2 clusters can be useful. In util.clj we introduce a new helper function:
(defn class-dist "Show distribution of clustered metrics" [x y]                                                                                                                  
  (matrix (vec (for [i (range 3)                                                                                                                                                 
                     j (range 3)]                                                                                                                                                
                 (nrow (fdb :m2 :where {x i y j})))) 3))
Let's see the distribution of :BounceRateC and :PagesVisitC.

(class-dist :BounceRateC :PagesVisitC)

;; Result matrix
[85.0000  4.0000  1.0000
37.0000 75.0000 16.0000
26.0000 67.0000 43.0000]
We may use this matrix similar to how early explorers used compass. This example shows that there are 85 worst traffic sources that have above average Bounce Rate and below average Pages per Visit (North West of the matrix). 43 in "South East" shows number of the best performing traffic sources. We have 75 average traffic sources in the center. Happy exploring of Google Analytics data using Clojure, Incanter and MongoDB!

Friday, January 4, 2013

Part 4 of Exploring Google Analytics data using Clojure, Incanter and MongoDB

Making data-driven decision on media selection helps increasing Return on Investment. Weighted sort feature of Google Analytics enables you to sort traffic sources while eliminating long-tail problem. In this post we will use an updated weighted sort function that produces the same sort order as Google Analytics' built-in feature.

Weighted Sort table

util.clj

There is a new wavg (weighted average) function and updated etv-ws and weighted-sort-row functions.
(defn wavg
  "Calculate weighted average of a row"
  [weights row]
  (cond (= (count row) 0) 0
        (= (count row) 1) (first row)
        :else  (/ (reduce +' (map * row weights))
                  (reduce +' weights))))

(defn etv-ws
  "Estimated weighted sort value for y based on x where mx maximum of Xs, ay weighted average of Ys."
  [x y mx ay]
  (let [etv ($= (ay + (x / mx * (y - ay))))
        ]
    etv))

(defn weighted-sort-row
  "Calculate and store weighted sort value in coll using wrow as weight.                                                                                                         
   Store new weigted values in rowW name as new column"
  [coll wrow row]

  (let [oids (fdr coll :_id)
        xdata (fdr coll wrow)
        ydata (fdr coll row)
        ay (wavg xdata ydata)
        mx (reduce max xdata)
        ]
    (pmap (fn [y]
            (let [oid y
                  rec (fetch-one coll :where {:_id oid})
                  x (wrow rec)
                  y (row rec)
                  w (etv-ws x y mx ay)
                  log (update! coll rec (merge rec
                                               {(keyword (str (name row) "W")) w}))
                  ]))
          oids)))


desktop.clj

Let's use weighted sort on BounceRate using Visits as weight. weighted-sort-row functions stores calculated weights in BounceRateW.
;; Calc weighted sort for BounceRate                                                                                                                                             
(weighted-sort-row :m2 :Visits :BounceRate)
;; Check collection                                                                                                                                                              
(fdb :m2 :limit 1)
;; Result                                                                                                                                                                        
[:BounceRateW :BounceRate :NewVisits :Visits :SourceMedium :AvgVisitDuration :PagesVisitC :PagesVisit :_id :AvgVisitDurationC :VisitsC :NewVisitsC :BounceRateC]
[0.39453393212385945 0.6667000000000001 0.3333 3 47 6 0 1.33 # 0 1 1 0]
;; new :BounceRateW appeared in collection

;; You can compare results with Google Analytics' weighted sort                                                                                                                  
(view ($order :BounceRateW :asc (fdb :m2 :only [:BounceRateW :SourceMedium :Visits])))
;; Name of each SourceMedium                                                                                                                                                     
(def SourceMedium (fdd :m1 :SourceMedium))
;; SourceMedium indexes sort by weighted BounceRate in ascending order                                                                                                           
(def SourceMediumBounceRateW ($ :SourceMedium ($order :BounceRateW :asc (fdb :m2 :only [:BounceRateW :SourceMedium ]))))
;; View sorted traffic sources in human readable form                                                                                                                            
(view (map (fn [y] (nth SourceMedium y)) SourceMediumBounceRateW))


You may use weighted sort for other metrics too. If you reallocate the daily budget of the worst performing traffic sources to the above average performing ones, you have a simple adaptive model for increasing the Return of Investment of marketing budget.

Sunday, December 23, 2012

Part 3 of Exploring Google Analytics data using Clojure, Incanter and MongoDB

Classifying Google Analytics All Traffic Sources helps us to make a better decision on media selection. You may not spend money on a medium that sends above average bouncing visitors. As described in my previous post we use a simple classification method: below average:0, average:1, above average:2.

 
 ; Let's check column names in :m2                                                                                                                                              
  (fdb :m2 :limit 1)
  [:_id :SourceMedium :Visits :PagesVisit :AvgVisitDuration :NewVisits :BounceRate]
  [# 1 5336 3.75 192 0.41 0.44659999999999994]
  ; Let's classify each metric                                                                                                                                                   
  (classify-row :m2 :PagesVisit)
  (classify-row :m2 :BounceRate)
  (classify-row :m2 :NewVisits)
  (classify-row :m2 :AvgVisitDuration)
  (classify-row :m2 :Visits)
  ; Let's check column names in :m2 again                                                                                                                                        
  (fdb :m2 :limit 1)
  ; We can see that each classified metric has a new column now                                                                                                                  
  [:BounceRate :NewVisits :Visits :SourceMedium :AvgVisitDuration :PagesVisitC :PagesVisit :_id :AvgVisitDurationC :VisitsC :NewVisitsC :BounceRateC]
  [0.6214 0.655 832 2 99 1 2.02 # 1 1 1 0]
  ; Let's use Incanter for charting 3 metrics
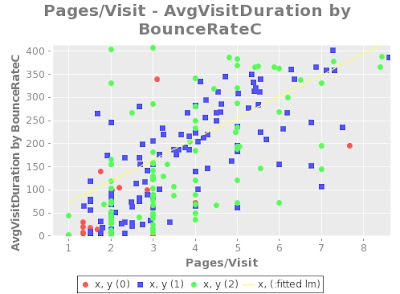
  (lm-gchart (fdr :m2 :PagesVisit) (fdr :m2 :AvgVisitDuration) "Pages/Visit" "AvgVisitDuration by BounceRateC"  (fdr :m2 :BounceRateC))

You may try out lm-gchart on your own.

Pages/Visit and AvgVisitDuration scatter-plot groupped by BounceRateC

Pages/Visit and AvgVisitDuration scatter-plot grouped by BounceRateC. Red dot means high-bouncing traffic sources, blue is average and green means below average bouncing traffic sources.

Functions of clojure.math may be your friend while exploring GA data.

;; combinations of two metrics
(clojure.math.combinatorics/combinations [:PagesVisit :BounceRate :Visits :AvgVisitDuration :NewVisits] 2)
;; Result:
((:PagesVisit :BounceRate) (:PagesVisit :Visits) (:PagesVisit :AvgVisitDuration) (:PagesVisit :NewVisits) (:BounceRate :Visits) (:BounceRate :AvgVisitDuration) (:BounceRate :NewVisits) (:Visits :AvgVisitDuration) (:Visits :NewVisits) (:AvgVisitDuration :NewVisits))
;; combinations of three metrics
(clojure.math.combinatorics/combinations [:PagesVisit :BounceRate :Visits :AvgVisitDuration :NewVisits] 3)
;; Result:
((:PagesVisit :BounceRate :Visits) (:PagesVisit :BounceRate :AvgVisitDuration) (:PagesVisit :BounceRate :NewVisits) (:PagesVisit :Visits :AvgVisitDuration) (:PagesVisit :Visits :NewVisits) (:PagesVisit :AvgVisitDuration :NewVisits) (:BounceRate :Visits :AvgVisitDuration) (:BounceRate :Visits :NewVisits) (:BounceRate :AvgVisitDuration :NewVisits) (:Visits :AvgVisitDuration :NewVisits))

Saturday, December 22, 2012

Exploring Google Analytics data with Clojure, Incanter and MongoDB Part 2

Now we have some helper functions. Let's use them to import and process Google Analytics CSV export file. In my last post we defined initdb function. Please set path_to_dir according to your environment in util.clj at defn initdb.
 (prn (:out (clojure.java.shell/sh "/path_to_dir/mediana/00import2mongo.sh" "/path_to_dir/Analytics-All-Traffic-20121120-20121220.csv" "c5" "m1")))

desktop.clj

We evaulate functions interactively. Open mediana/src/mediana/core.clj in Emacs. M-x clojure-jack-in starts a slime session and a repl. pressing C-x C-e right after a closing clojure evaluates expression or M-x slime-eval-last-expression. A whole file can be evaluated by pressing C-c C-k or M-x slime-compile-and-load-file. A active region can be evaluated by C-c C-r or M-x slime-eval-region.
(in-ns 'mediana.core)
;;:SourceMedium :PagesVisit :Visits :AvgVisitDuration :NewVisits :BounceRate                                                                                          
;; Desktop                                                                                                                                                                       
(defn nopfn []
 ;; Import csv into :m1 then process it into :m2                                                                                                                                
  (initdb)
  ;; Fetch "google /organic" data from :m1                                                                                                                                       
  (fdb :m1 :where {:SourceMedium "google / organic" })
  ;; Result:                                                                                                                                                                             
  [:_id :SourceMedium :Visits :PagesVisit :AvgVisitDuration :NewVisits :BounceRate]
  [# "google / organic" "25,104" 5.38 "00:05:32" "39.93%" "33.42%"]
  ;; What is the index of "google / organic" string in :SourceMedium row?                                                                                                        
  (iof "google / organic" (fdr :m1 :SourceMedium))
  ;; 352                                                                                                                                                                         
  ;; Get record from :m2                                                                                                                                                         
  (fdb :m2 :where {:SourceMedium 352})
  ;; Result:                                                                                                                                                    
  [:_id :SourceMedium :Visits :PagesVisit :AvgVisitDuration :NewVisits :BounceRate]
  [# 352 25104 5.38 332 0.3993 0.3342]
  ;; Processing works fine.  
Now we have a working dataset in :m2 collection. Let's see some data.
;; What is the correlation between :PagesVisit and :AvgVisitDuration ?                                                                                                         
  (correlation (fdr :m2 :PagesVisit) (fdr :m2 :AvgVisitDuration))
  ;; 0.7215517848024166                                                                                                                                                          
  ;; It is a strong correlation. Let's see it in a chart with a linear-model:                                                                                                    
  (lm-chart (fdr :m2 :PagesVisit) (fdr :m2 :AvgVisitDuration) "Pages/Visit" "Avg Visit duration in sec")

Linear model details

  (def lm (linear-model (fdr :m2 :PagesVisit) (fdr :m2 :AvgVisitDuration)))
  (keys lm) ; see what fields are included                                                                                                                                       
  (:design-matrix lm) ; a matrix containing the independent variables, and an intercept columns                                                                                  
  (:coefs lm) ; regression coefficients                                                                                                                                          
  (:t-tests lm) ; t-test values of coefficients                                                                                                                                  
  (:t-probs lm) ; p-values for t-test values of coefficients                                                                                                                     
  (:fitted lm) ; the predicted values of y                                                                                                                                       
  (:residuals lm) ; the residuals of each observation                                                                                                                            
  (:std-errors lm) ; the standard errors of the coeffients                                                                                                                       
  (:sse lm) ; the sum of squared errors,                                                                                                                                         
  (:ssr lm) ; the regression sum of squares                                                                                                                                      
  (:sst lm) ; the total sum of squares                                                                                                                                           
  (:r-square lm) ; coefficient of determination 

Histogram

  (view (histogram (fdr :m2 :PagesVisit) :nbins 50))
  (view (histogram (fdr :m2 :BounceRate) :nbins 50))
  (view (histogram (fdr :m2 :NewVisits) :nbins 50))
  (view (histogram (fdr :m2 :AvgVisitDuration) :nbins 50))
  (view (histogram (fdr :m2 :Visits) :nbins 50))

Classifying Metrics

We use a simple classification: average : 1, below average: 0, above average: 2 for a metric as described in classify-row function. In my next post we take a look at it.